RGB Money in the production chain
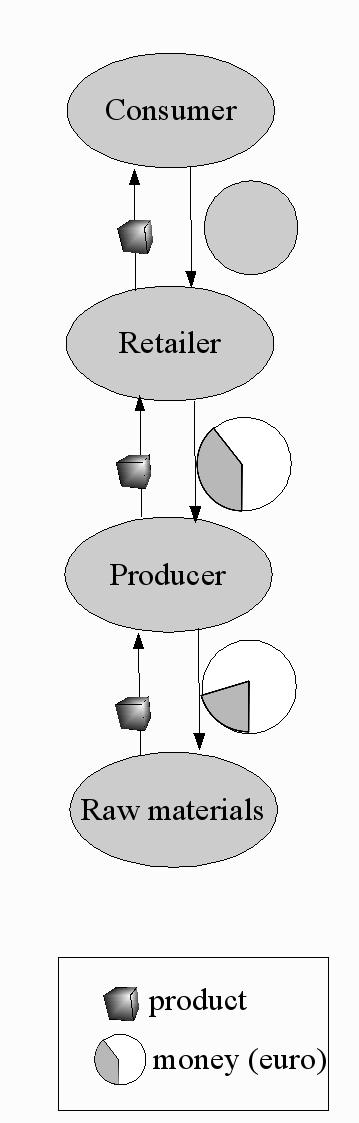
Let’s go back to the base of our present economical system. The production chain. In the picture you see that products are traded from raw materials to consumer. The products travel one way, while money goes the opposite direction (up stream). In this figure, products go up and money goes down in the production chain.
 The production chain using regular money
The picture uses pie charts which show which portion of the “consumer price” is being paid. Obviously the consumer pays the most, the shopkeeper keeps a part, the manufacturer also keeps a part and the rest goes to the suppliers of Raw materials. This model is obviously a simplified representation because in real life there isn’t a product which has such a simple production column. But it works as a model.
Colours in the economic cycle.
Now we have seen how money moves in an economic cycle, we also want to know how Red, Green and Blue money moves. The notion of a circle is just as elementary as the notion that Earth revolves around the Sun and not the other way round. It might take a while before you see the picture. On the other hand, once you got it, you don’t need this book any more. Reality gives a clearer insight than a theoretical model.
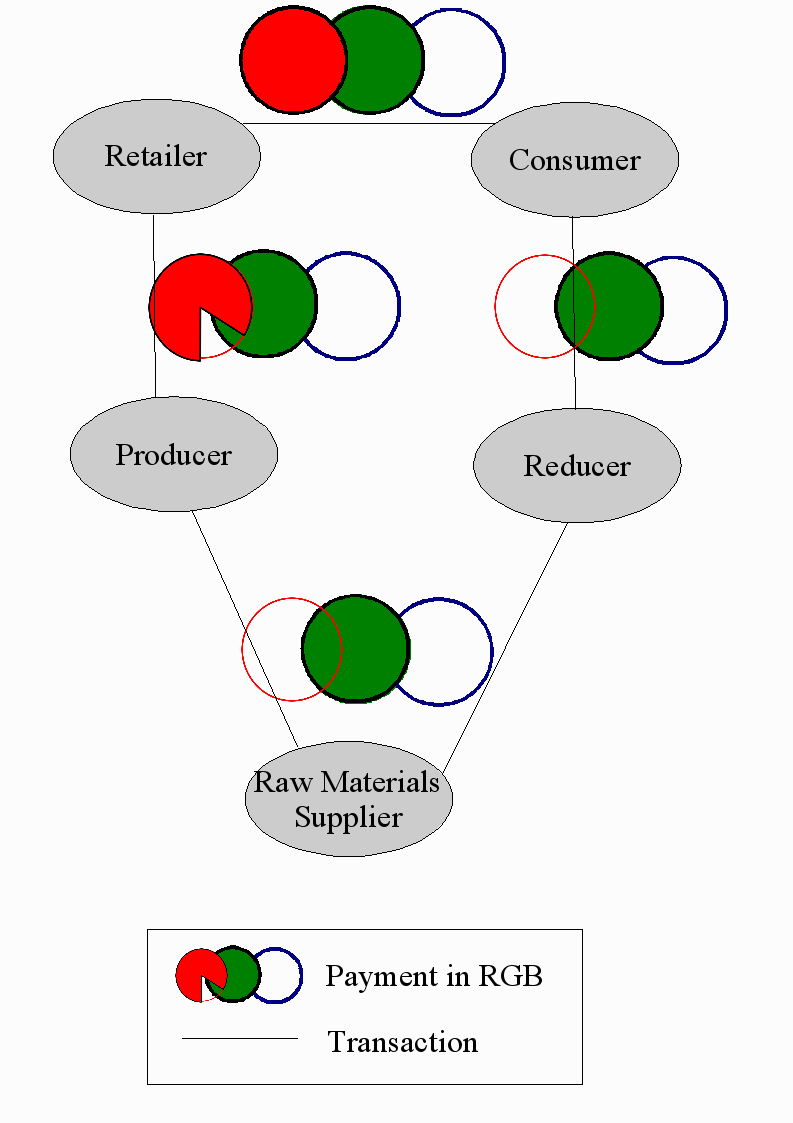
In Figure 6 we see the same players in the production chain, from the supplier of raw materials to the producer to the retailer to end consumer. The destructor or reducer is a new player. The destructor destroys the waste-stream that comes from the consumer and converts it back to original Raw Material. This can be collection of used glass, paper or tins. It can be collection and composting of organic waste. In any case the destructor closes the cycle.
Thanks to the reducer or destructor we can close the cycle. The result is that raw materials and the material in the product are valued as “green”. We don’t need Blue yet. In this cycle, the value of green is 100%, because all materials are recycled.
The easiest way to accomplish this is if a producer decides to become the main reducer as well. This situation is often used in the Cradle to Cradle business paradigm, a way to bring nature into business. For now, we will continue to bring economics into nature. The Cradle to Cradle concept is further explained in the last part of this book.
The value of “Red” varies during the life cycle just like the value in Euro varies in a traditional production chain. Raw materials don’t have any or very little energy. The manufacturer adds a lot to this value and the consumer pays the full price in Red.
 RGB Values in a closed life cycle
In this figure, products travel clock wise while RGB coins travel counter clock.
The pie charts are used here to give the idea, as is usual in models. The real price will be determined in real life. In principle the “Red” value at the beginning and end of the cycle is “nil” or very low. Just like the Sun rises , gets to its peak height at noon, and sets at the end of the day.
How does Blue get in?
It gets a bit more complicated when a product or part of a product no longer gets recycled. Then Blue enters the picture. Blue takes over part of the role of Green. Green is used for matter (read weight) that’s inside the cycle. Blue is what you pay when you know this matter leaves the cycle. In both cases you measure the weight. 100 grams is either 1 Green or 1 Blue. Someone always carries the brunt, some one ends up being responsible for a product getting out of the cycle. Someone who’s stuck with Blue and has a shortage of Green.
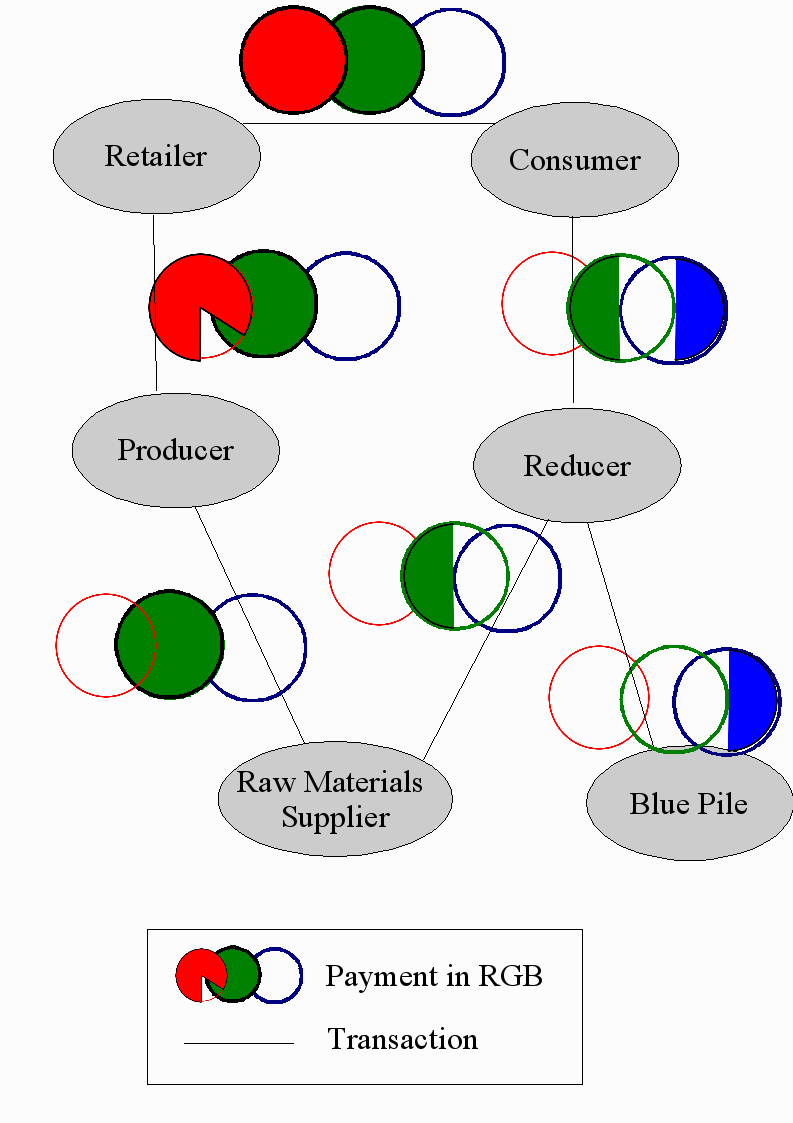
In the following example we pretend the consumer is responsible for half the non-recycled product, the other half is recycled. Apparently the consumer made the choice to use the product in such a way it couldn’t be recycled any more.
 RGB Values in a partly closed life cycle
We see an extra player coming into play, the Blue Pile. This is a virtual participant. The Blue Pile represents all garbage dumps, incinerator and other place where waste is dumped into the environment. Whenever it’s outside the cycle, it becomes Blue. In this case the reducer bought the waste product of the consumer for R0 G 1/2 B 1/2. The consumer paid R 1 G 1 B 0 when he bought the product. This means that the consumer is stuck with an end balance R-1 G-1/2 B1/2. The deficit in Red can be made up for through labour, as usual, but the loss of Green can’t be recovered.
That is exactly how things work in the present reality, when a product gets out of the cycle, it can’t be compensated for either. The off balance stays in the books, until the waste is cleared or an equal amount of matter, with the same weight, is re-introduced into the cycle form outside the cycle.
The combination of the use of these colours and the way they behave in the cycle gives you a clear idea of reality when it comes to energy and the recycling ratio. When we compare to the production chain again we see there is no connection between price and cycles or energy. In fact, money “promotes” the destruction of raw materials and energy. The model shown here is a, in a “model” sense” almost perfect solution for the “internalizing” of environmental cost. But to be able to use it we need to respect some rules of conduct, some basic “life-laws” which we will look into before we go to examples with numbers.